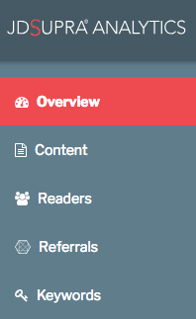
Here's a quick overview of three metrics you should monitor on an ongoing basis in your JD Supra analytics:
1. What people are reading — available as a module on the main analytics dashboard and also by clicking through to "Content," this is a measure of total view counts of work. Check in regularly to see which posts readers find most  compelling.
2. Who read you — also prominently available on the main analytics dashboard and by clicking through to "Readers," this is a report of the people who have read specific articles. We share name, title, company, and industry information when it is available and we have permission to do so. The "Readers" report enables anyone to see clients, prospective clients, and readers within target industries, which work they are reading, and how frequently.
3. Social engagement — you can also see who tweeted your publications, followed you for new work as it is published via JD Supra, and linked to your posts from sites around the web. Again, all three of these reports are available from the main analytics dashboard and each offers insight into which work is doing especially well, and with whom it is resonating.
Note that anyone can also export these reports in Excel format for internal sharing and discussion. Simply click the yellow Export button on any page.
This tip applies equally for a marketing manager monitoring the impact of firm-wide or practice group specific content; or an author logging in to see the results of just their own writing.
*
[This post appeared originally as a JD Supra Tip of the Week, emailed each Thursday morning by VP of client service, Paul Ryplewski. Clients: to receive Paul's tips by email, log into your account dashboard and select Tip of the Week on your Subscriptions page. ]
